
Every insulation decision starts with how heat moves through a building. The R-value is the lab-tested measure of an insulation layer’s thermal resistance under steady conditions. Designers and contractors use that value to match assemblies to local climate demands, manage seasonal energy loads, and support predictable performance over the life of the building.
What R-Value Means in Real-World Assemblies
On plans and product data sheets, that number represents the tested resistance of the insulation layer, but assemblies only deliver performance close to that rating when the insulation stays intact across the enclosure. The insulation has to maintain thickness, stay dry, and remain continuous across the assembly so conduction cannot bypass it.
When framing, gaps, or wet materials interrupt that layer, the rated resistance becomes a theoretical number rather than a performance you can depend on in the field. Thinking in terms of assemblies rather than individual products helps designers close the gap between calculated resistance and how the enclosure behaves over time.
How Insulation R-Value Works
Insulation performance begins with how materials slow conduction through the building enclosure. Assembly behavior depends on how well the insulation stays aligned with air and moisture control layers, because voids or irregular thicknesses change how heat moves through the system.
R-Value vs. U-Value
R-value measures resistance to heat transfer, while U-value expresses how quickly heat moves through a building component. Assemblies combine material resistance and thermal bridging from framing, which influences both measurements.
What Affects R-Value in Practice
Higher values slow conduction, but performance depends on trapped air, moisture behavior, and material alignment. A fiberglass batt compressed between studs loses resistance because its air pockets collapse, while foam boards with unsealed seams allow air to move through gaps and increase heat transfer. Uneven coverage in blown products also creates thin spots that weaken total assembly resistance.
Understanding an Insulation R-Value Chart
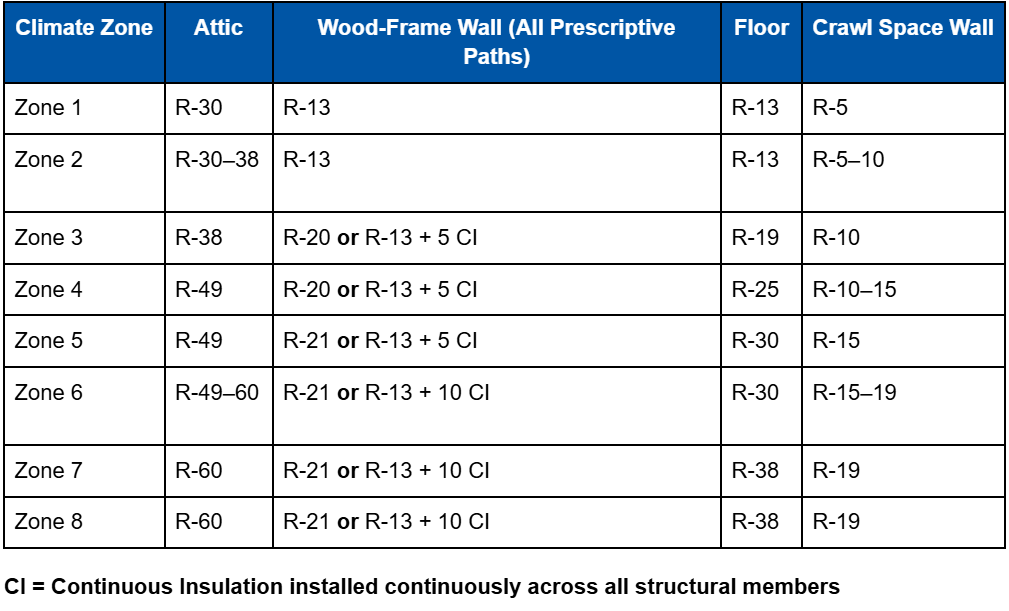
An insulation chart organizes recommended resistance levels by climate zone, occupancy, and building component. These values help establish a baseline, but charts assume correct air sealing, accurate installation thickness, and limited thermal bridging. The chart below aligns expected resistance with typical enclosure demands across the United States.
Climate Zone R-Values (2021 IECC)
How To Interpret an R-Value Chart in the Field
Charts provide nominal resistance targets, but assemblies rarely behave like isolated materials. Real walls lose resistance through stud lines, fastener patterns, transitions, and locations where insulation cannot maintain full thickness. Continuous insulation corrects many of these weaknesses by covering the framing plane, which helps the whole assembly approach the value shown in the chart. When teams select a nominal level of thermal resistance, they must match it to the framing density, transitions, and load paths of the enclosure.
R-Value Insulation Types and Their Application
Different insulation materials deliver rated performance only when installed under proper field conditions. This section explains how each behaves in real assemblies.
Batts and Rolls
Fiberglass batts deliver consistent resistance when installed without compression and paired with air control layers. They fit cleanly in open framing cavities where installers can verify placement.
Loose-Fill and Blown-In
Blown-in insulation adapts to irregular framing layouts but must reach correct density and coverage to avoid thin spots. Underfilled areas create local heat paths that reduce overall resistance.
Rigid Board Insulation
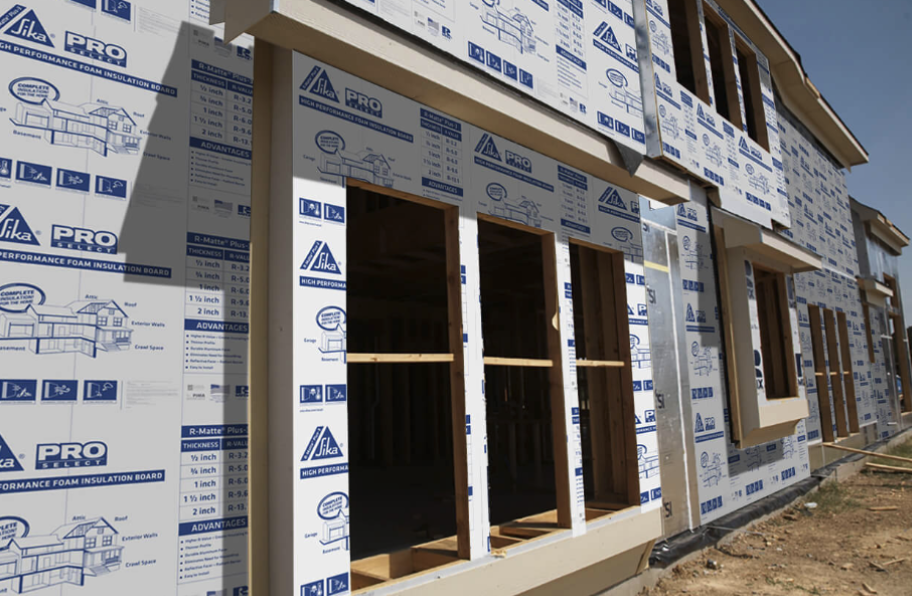
Rigid board insulation provides continuous resistance and reduces thermal bridging through framing. Installed outside the structure, it establishes predictable whole-wall resistance and creates a stable surface for exterior cladding.
Spray Foam
Spray foam combines resistance and air sealing, though consistent performance depends on correct mixing, substrate conditions, and applied thickness. When installed to specification, it delivers predictable resistance across the enclosure.
Choosing the Right R-Value for Your Climate
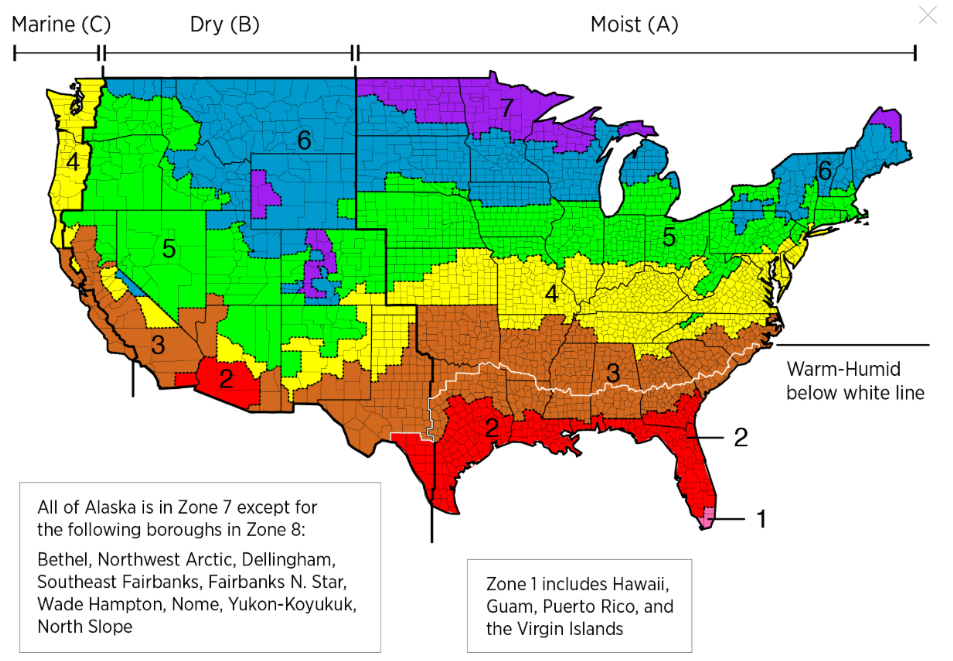
Climate determines the thermal load the enclosure must resist. Heating-dominant climates require higher resistance to slow conductive losses, while cooling-dominant climates prioritize reducing heat gain and controlling air infiltration. Refer to the climate-zone map posted by the DOE’s Building America program to identify your project’s zone.
Warm Climates (Zones 1–3)
Assemblies in warm regions concentrate on limiting heat gain. Moderate insulation levels combined with strong air sealing typically meet enclosure requirements, and roofs benefit from reflective surfaces and ventilation strategies that limit temperature spikes.
Moderate Climates (Zones 4–5)
Mixed climates experience seasonal shifts that require balanced assemblies. Walls commonly combine cavity insulation with continuous insulation to stabilize performance throughout the year and address both heating and cooling loads.
Cold Climates (Zones 6–8)
Cold regions require higher resistance because long heating seasons create large indoor–outdoor temperature differences. Continuous insulation becomes essential because framing, sheathing joints, and fasteners can significantly reduce whole-wall resistance. Roof assemblies often pair deep cavity insulation with vented or unvented designs that protect the insulation layer from moisture accumulation.
Field Checklist: Making Sure Your Assembly Achieves Its R-Value
Installation determines how closely an assembly reaches its intended thermal resistance. Small field variations, such as gaps along framing, insufficient coverage at corners, or moisture at the substrate, can significantly alter performance. Each item below reflects a condition that must remain stable through the life of the enclosure.
Thickness, Compression, and Gaps
Insulation must maintain full installed thickness to deliver rated resistance. Compression, voids, or slumped sections create pathways where heat can move more easily.
Moisture, Air Movement, and Substrate Conditions
Moisture changes thermal characteristics by altering how materials trap air. Uncontrolled air movement forms convective loops that undermine resistance even when thicknesses are correct. Substrates must remain dry so adhered materials bond and maintain continuity.
Continuity and Thermal Bridging
Transitions at floor lines, wall intersections, and roof edges must carry the insulation plane continuously. Continuous insulation helps restore predictable resistance where framing interrupts the thermal layer.
How Rmax Rigid Insulation Fits Into R-Value Planning
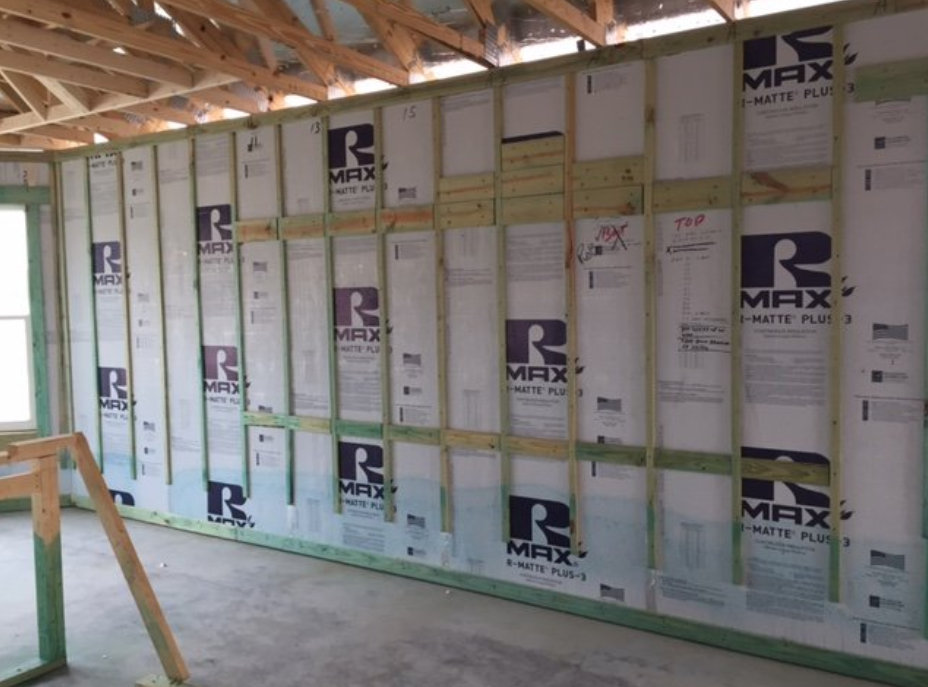
Rigid insulation supports predictable thermal behavior by covering framing elements and maintaining stable resistance across the enclosure. Its placement at the exterior sheathing reduces thermal bridges and provides a consistent substrate for cladding, air barriers, or weather-resistant layers. Projects use continuous rigid insulation to raise effective resistance, simplify transitions, and maintain long-term field performance, especially in climates with wide temperature swings.
Choose Rmax Rigid Insulation for Reliable Thermal Performance
Rmax manufactures rigid insulation products designed for stable resistance, consistent detailing, and predictable long-term behavior in building enclosures. These materials help deliver whole-wall performance that meets energy-code expectations across varied climates. Contact us today for more information.