

Thermal performance is rarely a single number. EPS insulation R-value reflects how expanded polystyrene performs as thickness and density change, and how those variables carry through into real assemblies. That baseline matters because it shapes how charts are read and how EPS is compared to other rigid insulation options without over- or under-weighting a single published value.
What EPS Insulation R Value Means
Expanded polystyrene insulation is commonly described by R-value per inch. Across standard construction products, EPS delivers a narrow, repeatable range of thermal resistance because its insulating mechanism relies on air contained within a cellular structure. That mechanism does not depend on a trapped blowing gas, so the measured performance remains stable over time. Across common building products, EPS insulation typically delivers about R-4 per inch, depending on density.
In practice, EPS insulation R-value increases predictably as thickness increases. That behavior makes EPS a useful reference material when estimating how much insulation is required to reach a target assembly R-value and when comparing other materials on a per-inch basis.
EPS R-Value By Density And Thickness
EPS products are manufactured in different densities, and density influences thermal resistance per inch. Higher-density EPS typically posts slightly higher R-values while also delivering greater compressive strength, whereas lower-density options trade a small amount of thermal resistance for reduced material weight.
Thickness remains the primary driver of total R-value. Each additional inch contributes a similar increase in thermal resistance, which keeps calculations straightforward and repeatable. This relationship underpins how any EPS insulation R-value chart should be interpreted when EPS is compared to alternative materials. For example, reaching an assembly target near R-20 typically requires multiple inches of EPS rather than a thinner single layer.
Reading An EPS Insulation R Value Chart
When it comes to choosing the best insulation to cover a building envelope, it’s less about the shape of the material and more about its properties and performance. One measure to compare is the thermal resistance value, or R-value. A typical EPS insulation R-value stands firm at about R4 per inch of thickness. That means a one-inch thick board will have at least an R4 and a two-inch thick EPS board will have a minimum R8.
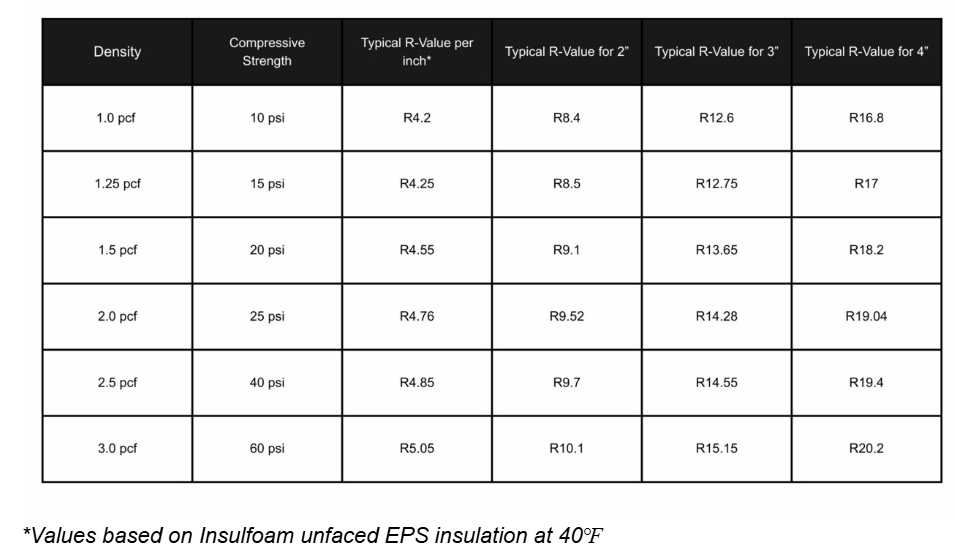
EPS is available in various densities, ranging from around 1-3 pounds per cubic foot (pcf), which in turn creates varying levels of compressive strength (from 10-60 psi). These factors impact thermal performance. Take a look at the EPS Insulation R-value chart below to check how the densities affect the R-value of EPS:
Typical EPS Insulation R-Value Chart
*Values based on Insulfoam unfaced EPS insulation at 40℉
As you can see, the R-value of EPS rigid insulation requires increasing thicknesses and/or densities in order to achieve a good thermal barrier. For example, if you want to meet the minimum R13 for walls, you’ll need at least 3” thick EPS. For an R20 wall, you’ll need 4” or more, depending on the density you select.
A Superior Alternative to EPS for Higher R-Values: Polyiso
Oftentimes, you just don’t have four inches to spare inside a wall cavity. So, if you’re looking for an alternative that packs more R-value per inch, one option is polyisocyanurate (polyiso).
R-Value of Polyiso Insulation
An EPS insulation R-value chart shows how total thermal resistance builds as board thickness increases across common EPS densities. These charts are meant to illustrate scaling behavior rather than to rank materials against one another.
The practical takeaway is thickness. Charts make it easy to see how much material depth is required to reach a specific total R-value, which becomes especially useful once assembly depth or framing limits come into play.
Types Of EPS Insulation And How They Affect R-Value

EPS is not a single, uniform product. Variations in formulation and surface treatment introduce modest differences in thermal performance and how R-value is applied within an assembly.
Standard EPS
Standard EPS boards establish the baseline performance most commonly associated with EPS insulation. Their R-value per inch falls within the typical EPS range and scales consistently as thickness increases.
Graphite-Enhanced EPS (GPS)
Graphite-enhanced EPS incorporates additives that reduce radiant heat transfer within the foam. This raises the R-value per inch compared to standard EPS. The gain is incremental, but it can reduce the overall thickness required to meet a specific target. Graphite additives can increase the R-value per inch compared to standard EPS, though the exact published value varies by product formulation.
Faced Vs. Unfaced EPS
Facings do not alter the core R-value of the EPS itself. Instead, they affect how boards interface with surrounding materials, which can influence installation continuity and how closely calculated performance aligns with field conditions.
What Affects the R-Value of EPS Insulation?
Several factors influence how EPS performs once it moves from published data into an installed assembly.
Density
EPS density affects R-value per inch within a relatively narrow band. Higher densities tend to post slightly higher thermal resistance while also improving compressive strength.
Thickness
Thickness controls total thermal resistance. EPS adds R-value in a linear way as thickness increases, which keeps performance projections clear and repeatable.
Temperature Conditions
Thermal resistance shifts as service temperatures change. EPS maintains relatively stable behavior across temperature ranges commonly encountered in wall and below-grade applications.
Installation Continuity
Gaps, misalignment, or compressed boards reduce effective thermal resistance regardless of material choice. Continuous coverage and consistent detailing help calculated values translate more reliably into field performance.
EPS Compared to Polyiso R-Value Per Inch
EPS is frequently evaluated alongside other rigid insulation types when space and performance targets intersect. Polyisocyanurate insulation is typically published with higher R-values per inch under standard test conditions, which allows target R-values to be reached with less material thickness.
EPS delivers a lower per-inch value, but it scales in a predictable way as thickness increases. Viewed side by side, the tradeoff becomes clear. EPS reaches higher total R-values by adding thickness. Polyiso reaches similar totals when assembly depth is limited by framing, roof build-up, or retrofit conditions.
Chart-Ready Comparison Framework
Nominal R-value per inch (typical published ranges)
EPS: approximately R-3.6 to R-4.2 per inch
Polyiso: typically higher published R-values per inch under standard conditionsThickness required to reach target R-values
EPS: increases linearly as thickness is added
Polyiso: reaches target values with less material depthInterpretation focus
EPS: predictable scaling across thickness options
Polyiso: efficiency where assembly depth is limited
EPS Performance in Wall Assemblies
In wall assemblies, EPS is commonly used as a reference point when evaluating total R-value requirements. Its predictable scaling makes it easy to illustrate how much thickness is needed and to compare that requirement directly against higher R-per-inch alternatives.
EPS also appears in discussions of panelized construction. In assemblies such as EPS insulated wall panels, insulation thickness and placement are coordinated with structure and finishes, reinforcing the value of understanding baseline R-value behavior.
EPS Performance in Foundations and Below-Grade Use
Below grade, insulation is exposed to soil contact, moisture, and sustained cool temperatures. EPS R-value behavior remains consistent enough under these conditions to serve as a practical comparison point when reviewing foundation insulation strategies.
Here again, thickness governs performance. As requirements increase, additional EPS thickness raises total R-value in a predictable way, allowing below-grade assemblies to be evaluated on an equivalent basis before considering higher R-per-inch options.
Specify Rmax Polyiso Insulation for High-R Assemblies
Rmax manufactures polyiso insulation products designed to deliver higher R-values per inch in wall, roof, and other building-envelope applications. When assembly depth is limited or higher thermal performance is required, polyiso provides an efficient alternative to thicker insulation layers. Contact us today for more information.
Frequently Asked Questions About EPS Insulation R Value
-
EPS delivers a lower R-value per inch than some rigid insulation materials under standard test conditions, but it scales predictably with added thickness. That consistency makes EPS a common reference point when comparing insulation options that reach higher R-values with less material depth.
-
EPS is often referenced in discussions of both wall and foundation insulation because its R-value behavior remains consistent across typical service conditions. Thickness requirements and space limitations usually determine whether EPS or a higher R-per-inch alternative is better suited for a specific assembly.